Web UI
SQE serves a read-only web dashboard on the coordinator’s health port
(metrics_port + 1, default 9091). It shows the queries the engine is running
and has run, per-query timing and fragments, the cluster nodes, and live engine
metrics. The data comes from the coordinator’s in-memory query tracker and
worker registry. The page adds no new instrumentation and never touches the
query path.
Access
-
Open
http://<coordinator-host>:<metrics_port + 1>/. With the defaultmetrics.prometheus_port = 9090, that ishttp://localhost:9091/. -
The same port also serves
/healthz,/readyz, and/api/v1/status. -
The UI is on by default. Turn it off with:
[metrics]
web_ui = false
When off,
/healthz,/readyz, and/api/v1/statusstill respond; the dashboard and the/api/v1/queries*endpoints return 404.
Security
There is no login. The dashboard is network-gated, the same posture as the
Prometheus /metrics endpoint: anyone who can reach the port sees every user’s
query text and the cluster state. Keep the health port on an internal network.
The UI is strictly read-only. It cannot submit queries, cancel them, or change
configuration. The query-detail endpoint deliberately omits session id, client
IP, and roles so the unauthenticated surface stays small.
Tabs
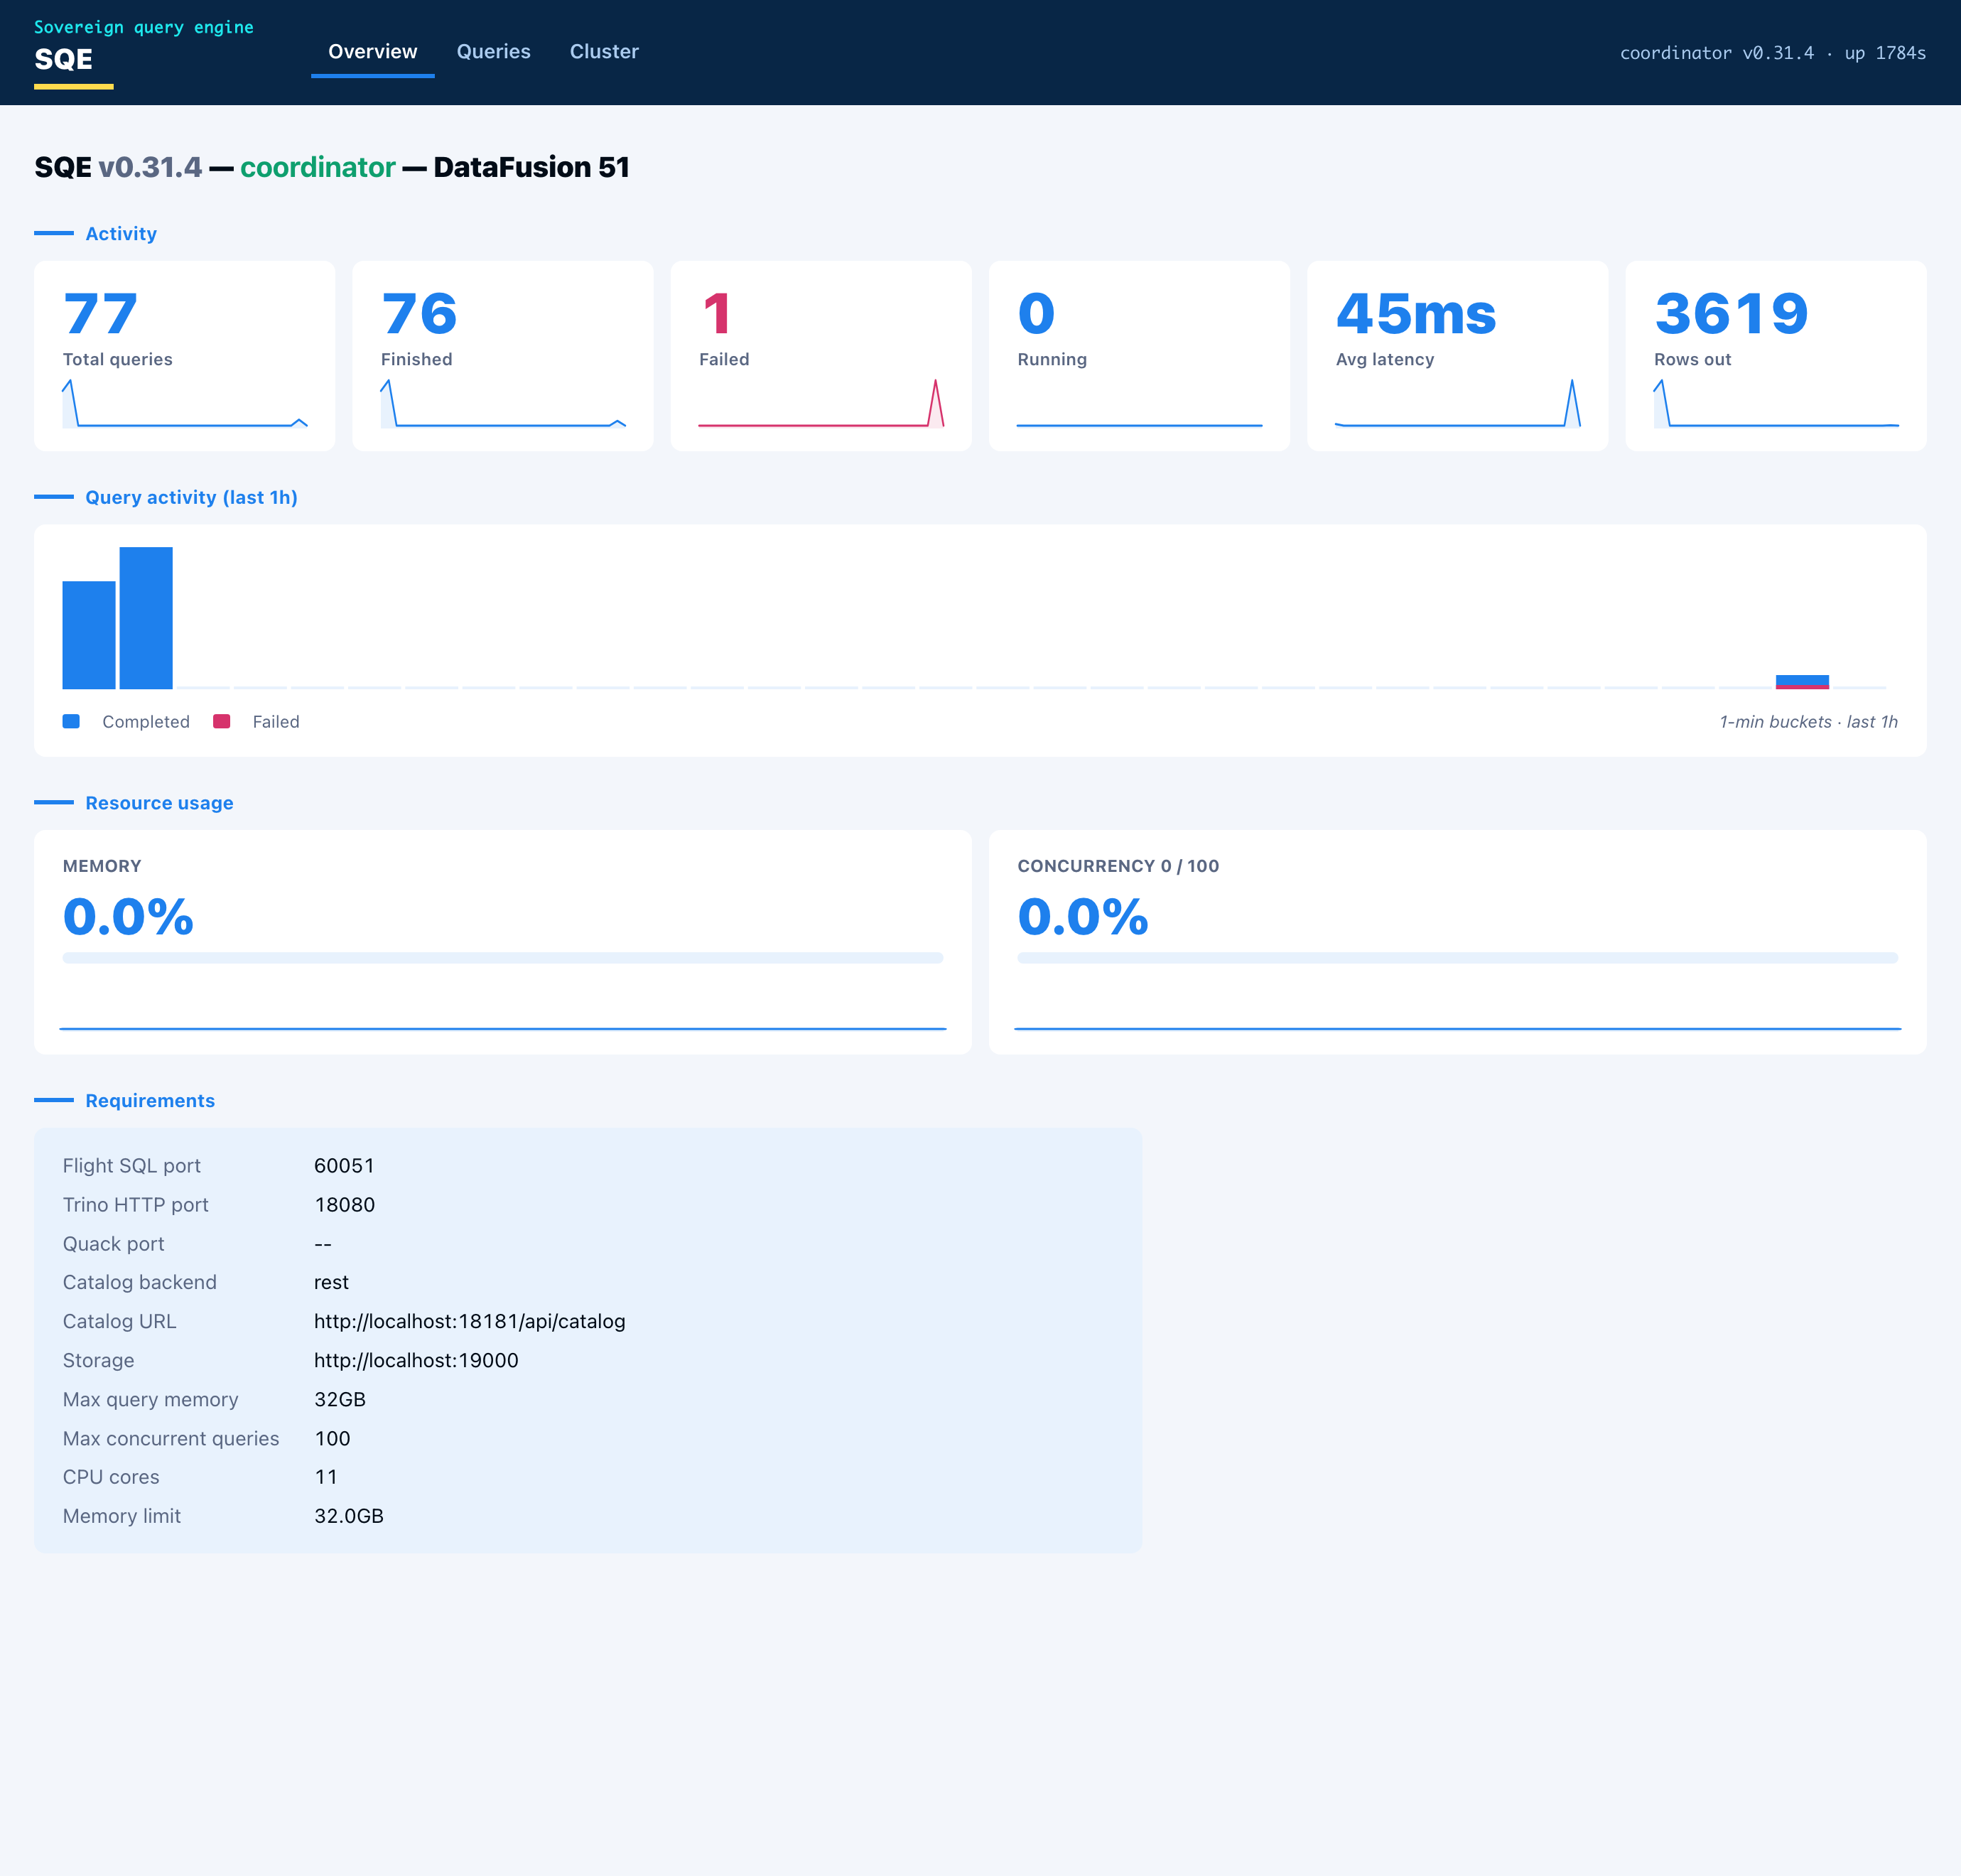
- Overview carries the node identity and capabilities (enabled protocols and ports, catalog backend and URL, storage, memory limit), live resource gauges (memory pool used, concurrency against the configured cap), and the engine metrics (queries by state, rows out, average latency) as stat cards. Each card has a one-hour sparkline, and a query-activity histogram sits below them.
- Queries lists recent queries with id, user, state, SQL, elapsed time, rows, and bytes scanned. Click a row for the detail: the queue, planning, and execution timing, the rows/bytes/spill/peak-memory totals, and the per-fragment breakdown showing which worker ran each fragment.
- Cluster shows the worker nodes with health and in-flight load. In single-node mode the coordinator lists itself as one node doing both roles.
Every chart is hoverable. Pointing at a bar or a sparkline point shows the time and value.
JSON API
The page is a thin client over a small JSON API on the same port. The endpoints are stable and safe to scrape directly:
| Endpoint | Returns |
|---|---|
GET /api/v1/overview | node, capabilities, resources, metrics |
GET /api/v1/queries?state=<running|finished|failed|all>&limit=<n> | recent queries, newest first |
GET /api/v1/queries/{id} | one query plus its fragments (404 if unknown) |
GET /api/v1/workers | worker nodes with health and in-flight load |
GET /api/v1/metrics/history | time-bucketed series for the charts |
GET /api/v1/status | Ballista/DataFusion-style cluster status |
How it is built
- One HTML page with vanilla JavaScript, embedded in the binary with
include_str!. No Node toolchain, no bundler, no external assets, no web fonts or logos. The visual language follows the Schuberg Philis palette and layout with system fonts. - The metrics history is an in-memory ring buffer. The coordinator samples query
counts, rows, latency, active queries, and memory-pool usage every five seconds
and keeps a rolling one-hour window.
GET /api/v1/metrics/historyaggregates the samples into one-minute buckets, so the charts advance a bar each minute and the current bar refreshes every sample.
For a longer history, scrape /metrics into Prometheus and chart it in Grafana.
The web UI is the at-a-glance view that ships in the binary.